PythonでMatplotlibを使ったグラフの作成方法を勉強中に
自分なりに工夫して試作したグラフを紹介します。
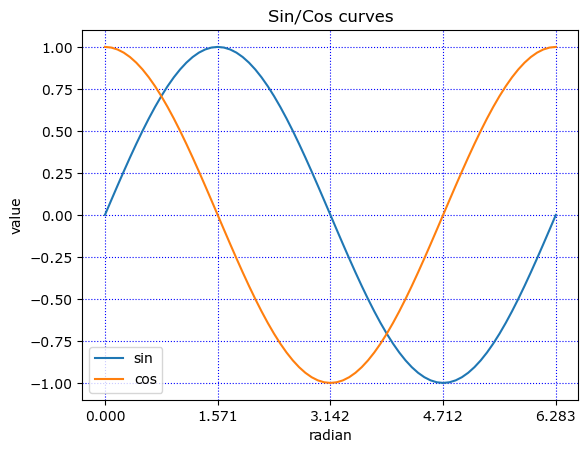
Pythonのプログラムと描けたグラフを載せておきます。
関数のグラフ
import numpy as np
import matplotlib.pyplot as plt

x = np.linspace(0, np.pi*2, 73)
y1 = np.sin(x)
y2 = np.cos(x)
fig, ax = plt.subplots()

plt.plot(x, y1, label='sin')
plt.plot(x, y2, label='cos')
plt.title('Sin/Cos curves')
plt.xlabel('radian')
plt.ylabel('value')
ax.set_xticks(np.linspace(0, np.pi*2, 5))
plt.grid(color='blue', linestyle=':')
plt.legend() # 凡例を表示
plt.show()
棒グラフ
import numpy as np
import matplotlib.pyplot as plt

x = np.array([1, 2, 3, 4, 5])
y = np.array([125, 95, 280, 160, 70])
fig, ax = plt.subplots()
ax.set_ylim(0, 300)
fruits = ["Apple", "Banana", "Orange", "Grape", "Strawberry"]

plt.bar(x, y, color="#1E7F00", linewidth=0, tick_label=fruits, align="center")
plt.grid(color='blue', linestyle=':', axis='y')
plt.show()
円グラフ
import numpy as np
import matplotlib.pyplot as plt

tokhyo = [1200, 900, 600, 300, 240, 100, 150] # 得票総数(万)
party = ['Jimin', 'Ritumin', 'Isin', 'Komei', 'Kyosan', 'Kokmin', 'Sinsen']

# 得票率を計算して小数点第1位までの%で表示する円グラフ
plt.pie(tokhyo, labels=party, shadow=True, autopct='%1.1f %%')
#plt.legend() # 凡例を表示するなら1桁目のコメントアウトを外す
plt.show()
ヒストグラム
import numpy as np
import matplotlib.pyplot as plt

# 平均150、分散8、件数1000 の正規分布に従う乱数を生成
shincho = np.random.normal(150, 8, 1000)

plt.xlabel('height (cm)')
plt.ylabel('number of students')
plt.hist(shincho, 20)
plt.grid(True)
plt.show()


